
Synthetic monitors are tools that help you keep track of your website’s performance. They can be in the form of API checks or virtual browser instances that simulate user interactions and record detailed information about each check. Here’s what monitors can do:
Capture aggregate numbers: Monitors provide an overview or summary of important metrics related to your website’s performance.
Provide detailed statistics: Monitors can give you in-depth information about downtime incidents and various page resources, allowing you to analyze and troubleshoot any issues.

Collect custom response codes: You can define specific response codes that you want your monitors to track. This helps you assess the performance of your monitors and identify any areas that need improvement.
- Creating synthetic monitors is a straightforward process that doesn’t require any installation.
- Go to one.newrelic.com and navigate to the Synthetic monitoring section.
- If you’re new to this, we suggest starting with a ping or step monitor.
- Follow the instructions to set up your monitor.
If you want to deploy multiple monitors simultaneously, you can explore the NerdGraph API synthetic monitoring tutorial, which allows you to automate monitor creation using API calls.
You can also create monitors using our synthetic monitoring REST API. To do this, make a GET request to retrieve the configuration details of your chosen monitor. Once you have the data, use POST to create a copy of the monitor.
Please note that the type of monitor cannot be changed once it is created, but you can modify other settings. To edit a monitor:
- Go to one.newrelic.com and select the Synthetic monitoring section.
- Select the monitor that you want to change.
- In the side menu, select the desired settings you want to change.
Make the necessary edits, such as modifying the name, URL, locations, frequency, advanced options, or the script for scripted browser and API test monitors.
- If you need to manage alerts for synthetic monitoring, click on “Manage alerts.”
- Save your changes to confirm the modifications.
- Deleting a monitor requires admin privileges. To delete a monitor:
- Go to one.newrelic.com and select the Synthetic monitoring section.
- select the monitor you want to delete.
- Click on “General” and then click the delete monitor button.
Alternatively, you can use the NerdGraph API or the synthetic monitoring REST API to delete a monitor.
These settings may include options to adjust the monitor’s frequency, define the locations from which it will be run, and access advanced options related to your specific monitoring needs.
Start using synthetic monitoring to ensure the continuous availability and performance of your application. Synthetic monitoring allows you to detect and resolve issues proactively before they impact your customers, and the best part is that it doesn’t require any installation.
If you want to check the performance of a specific page, including its full load time, follow these steps:
Also Read: 1v1.lol unblocked 76
Step 1 of 3:
Sign in to your New Relic account Log in to your New Relic account and navigate to one.newrelic.com. From there, go to Synthetic Monitoring and select “Create a monitor.” Choose the “Page load performance” option.
Step 2 of 3:
Enter the URL Copy the URL of the page For optimal results, we recommend selecting at least three deployment locations for your monitor. This helps minimize false positives. Additionally, you can adjust the time interval between checks using the Period dropdown. The frequency of deployments is entirely up to you.
Step 3 of 3:
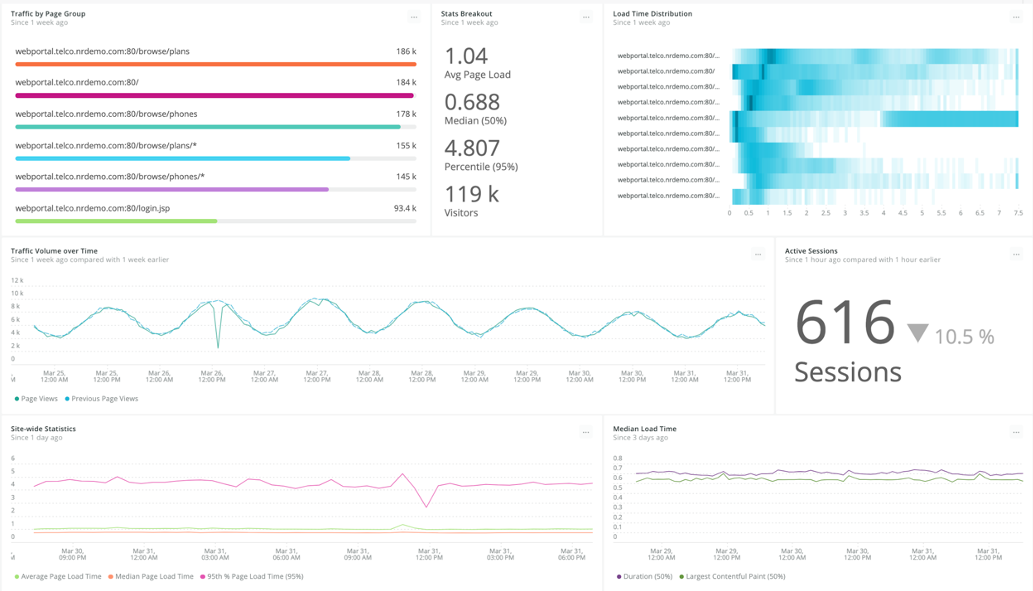
View your data Once your monitor starts reporting, you can access the data on the synthetics Summary page. To do this, visit one.newrelic.com, go to Synthetic Monitoring, select your monitor, and navigate to the Summary page.
If you want to simulate user workflows without writing any code, you can use codeless monitoring. This is useful for mimicking simple actions across your application, such as navigating between pages, testing page elements, or inputting text into fields. Here’s how to set it up:
Step 1 of 4:
Sign in to your New Relic account Log in to your New Relic account and go to one.newrelic.com. From there, navigate to Synthetic Monitoring and select “Create a monitor.” Choose the “User step execution” option.
Step 2 of 4:
Create your step monitor Provide a name for your monitor, specify the frequency at which it should run, and select the deployment location.
Step 3 of 4:
Define your steps Choose from a set of 12 prebuilt steps to construct your monitor. You can create a simple monitor that clicks buttons to navigate through pages or a more complex journey involving multiple actions like entering email, selecting from dropdowns, and submitting forms with secure credentials. Remember to click “Validate” to ensure that your steps run successfully before saving your monitor.
Step 4 of 4:
View your data Once your monitor begins reporting data, you can view it on the synthetics Summary page. To access this page, go to one.newrelic.com, navigate to Synthetic Monitoring, select your monitor, and click on the Summary page.
If you prefer to test website behavior and have more flexibility, you can use scripted monitoring. Scripted browser monitors allow you to simulate customer interactions and respond to different conditions on your site. Here are a few scenarios where scripted monitoring is a better choice:
- When you need to define custom timeout values
- When you want to perform actions not available in the step builder
- When you want to set conditions that alter the monitor’s path based on specific criteria
Now that you’ve set up your monitors, there are additional features you can explore. We recommend checking out the following documentation:
- Set up alerts for synthetic monitors to receive notifications when checks fail.
- Enhance your website by collecting real-user data alongside your synthetic data.
- Gain a general understanding of synthetic monitors by reading our overview documentation.